
Bitcoin Surges Above $78,000 on Unexpected Geopolitical Détente in the Strait of Hormuz
Bitcoin experienced a significant surge today, breaking above the $78,000 mark intraday, driven by an unexpected geopolitical development: Iran’s announcement that the Strait of Hormuz, a critical global oil chokepoint, will remain fully open amidst an ongoing ceasefire. This development has had a cascading effect across global markets, leading to a sharp decline in oil prices and a concurrent rally in risk assets, with Bitcoin leading the charge.
The sudden easing of tensions in a region that has been a focal point of geopolitical instability sent shockwaves through commodity and financial markets. For months, the broader macroeconomic environment had been characterized by a confluence of factors that weighed heavily on risk assets, including Bitcoin. Persistent Middle East tensions, lingering inflation fears, a strong U.S. dollar, and tight global liquidity had collectively contributed to a sustained downturn for Bitcoin, pushing it down from its all-time high of $126,000 reached in October 2025. Today’s news appears to have provided a much-needed catalyst for a potential shift in market sentiment.
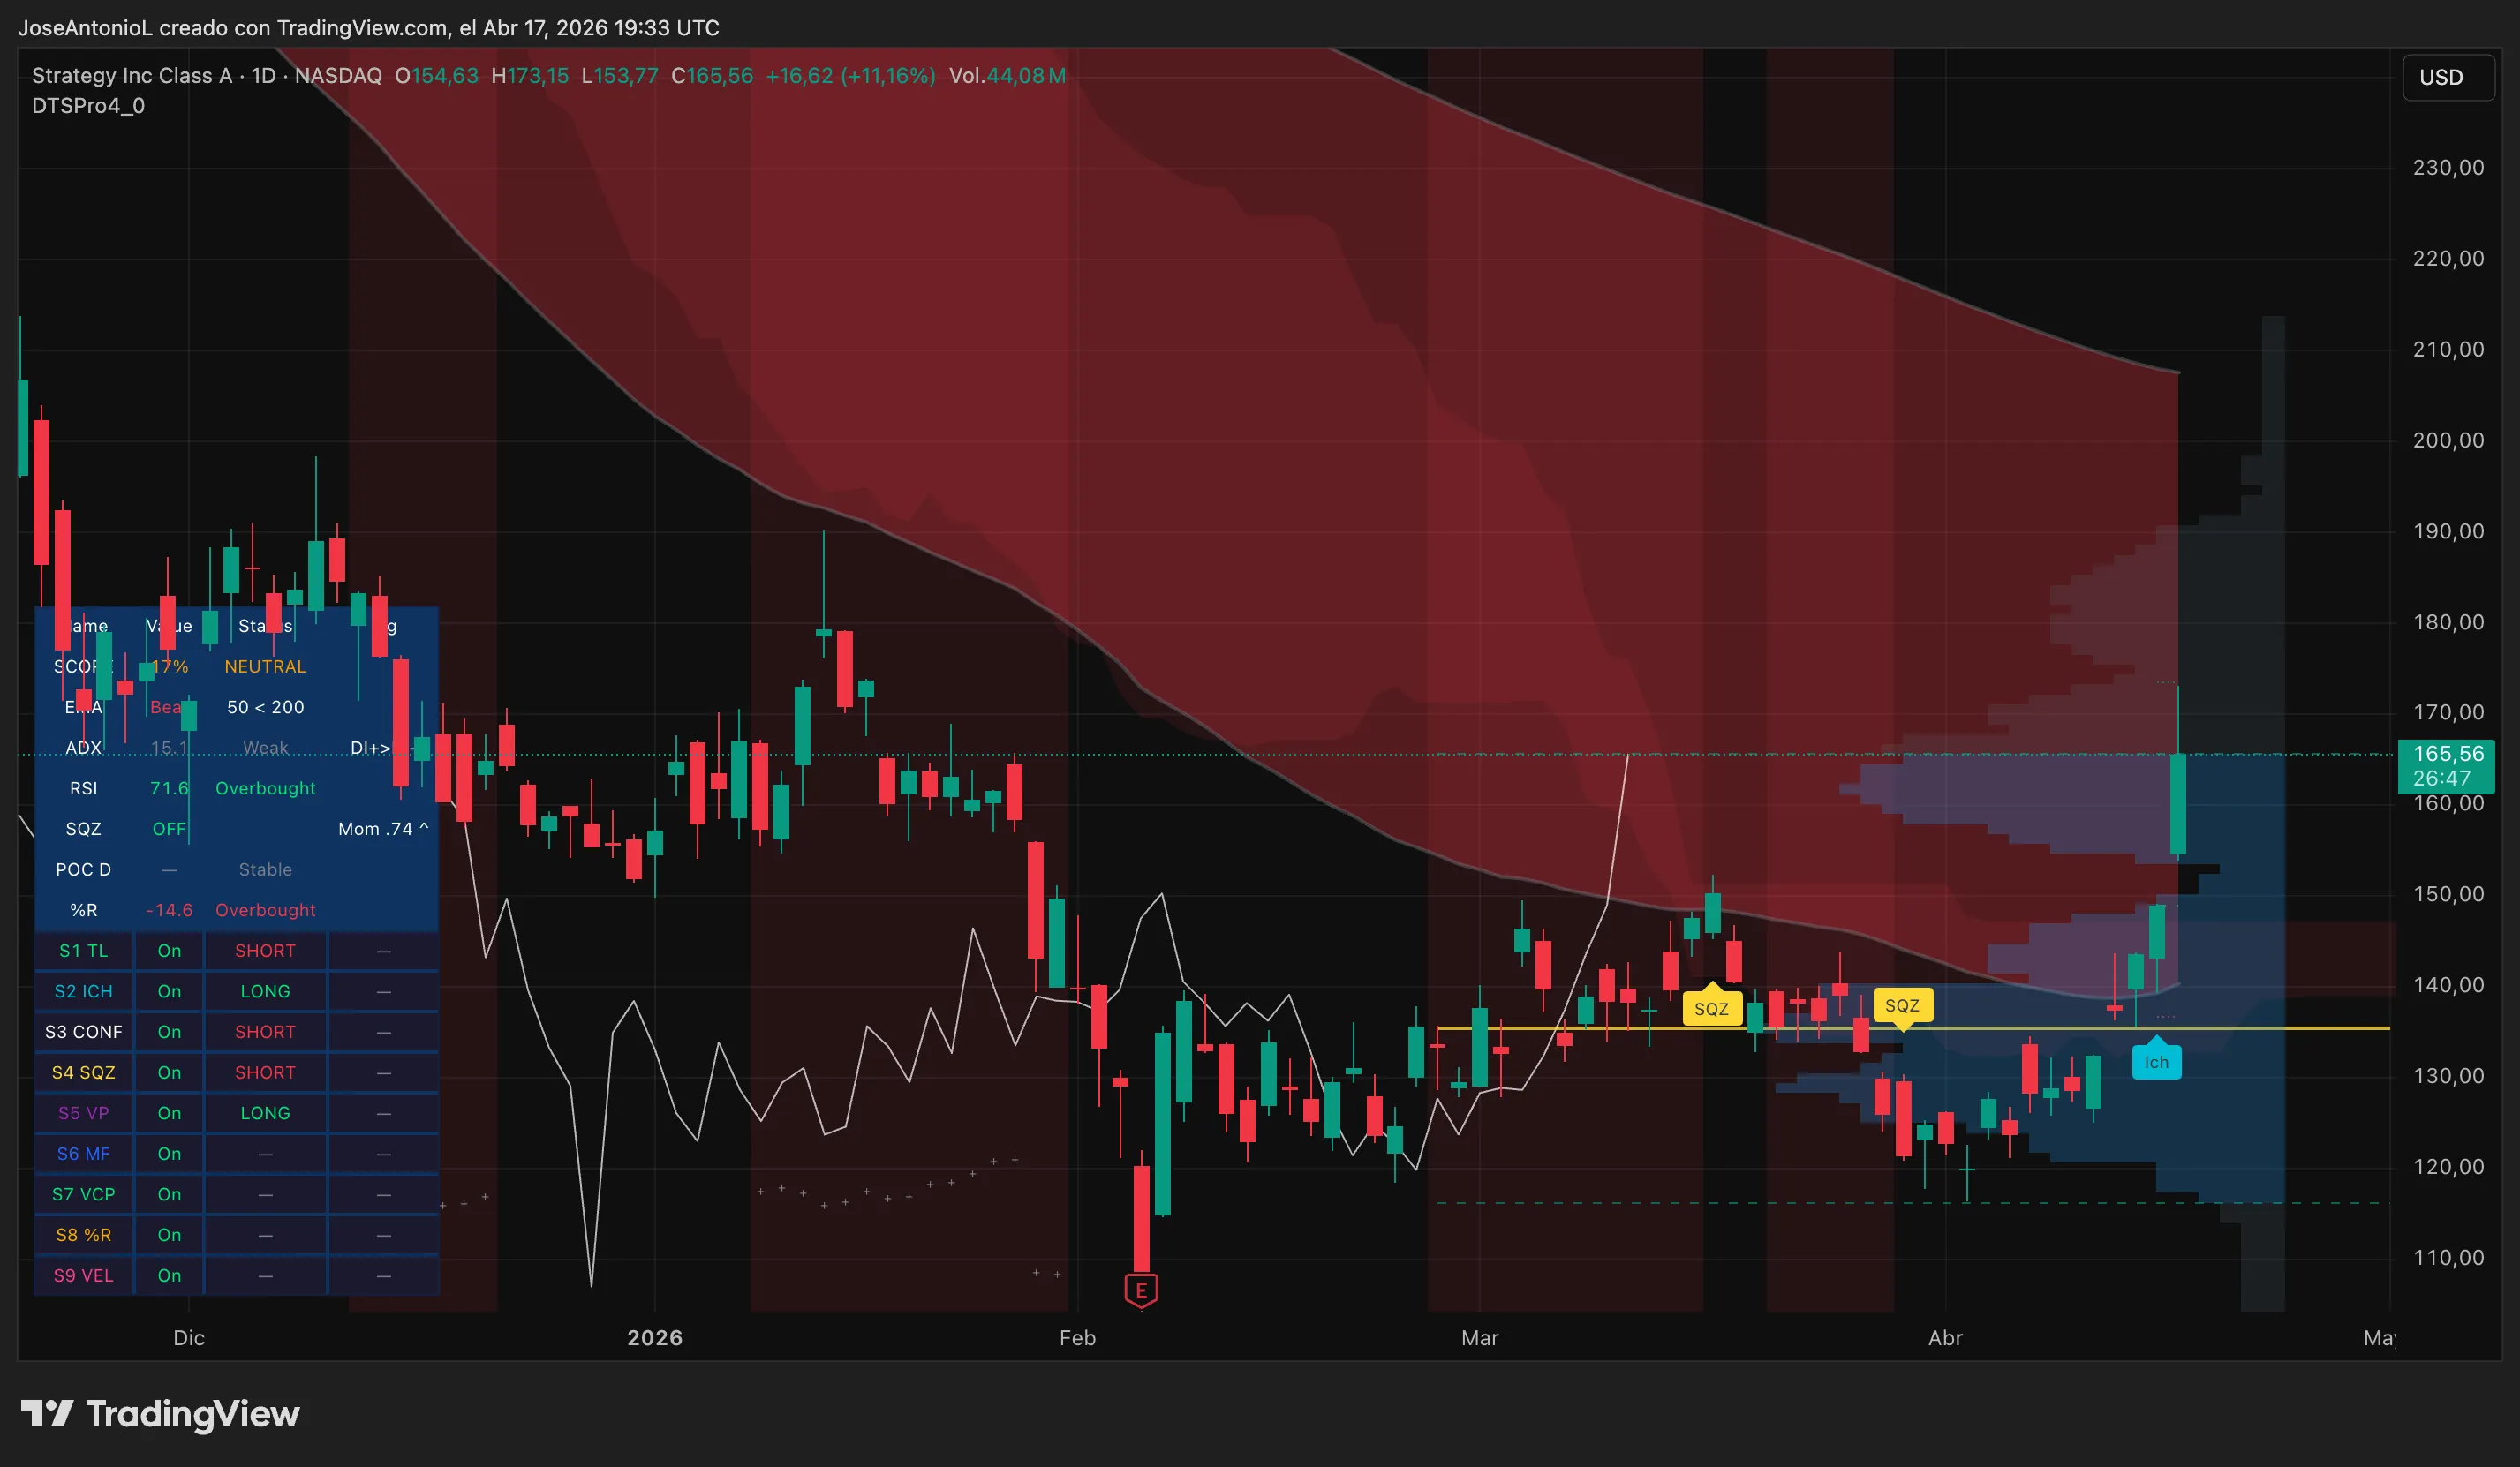
Digital asset treasury stocks also saw substantial gains, with companies like MicroStrategy experiencing over a 10% increase in their stock value as Bitcoin’s ascent boosted the valuation of their holdings, pulling them back from previous losses. This correlation underscores the significant impact of Bitcoin’s price movements on companies that have integrated it into their corporate treasury strategies.
Bitcoin’s Technical Breakout: A Shift in Market Dynamics
The price action observed in Bitcoin today is being closely scrutinized by market analysts, with many viewing the intraday surge and subsequent consolidation as a potentially significant technical event. Bitcoin opened the trading session at approximately $75,172 and was pushed higher by traders, reaching an intraday high of $78,384. This represented a substantial gain for the daily candle, signaling a renewed buying interest.
Crucially, this upward movement is being interpreted as a potential invalidation of the descending resistance trendline that has capped Bitcoin’s rallies since its peak in October 2025. For approximately seven months, this trendline had acted as a persistent barrier, effectively dictating a pattern of lower highs and lower lows. Market participants have closely watched this pattern, as it suggested a continued bearish trajectory for the cryptocurrency. The breach of this trendline, even if temporary, marks the first instance of Bitcoin trading above this significant resistance level since the bearish pattern began to form.
Prior to today’s development, technical analysis suggested that if the bearish trend had continued uninterrupted, Bitcoin could have potentially tested support levels between $50,000 and $55,000. The announcement regarding the Strait of Hormuz appears to have altered this trajectory, at least in the short term, delaying or potentially nullifying this downside scenario.
Key Indicators Signal Shifting Momentum
Beyond the price action, several technical indicators are offering insights into the evolving market sentiment. The Exponential Moving Averages (EMAs), which are used by traders to gauge underlying trends, still reflect a bearish structure with the 50-day EMA positioned below the 200-day EMA. This configuration, often referred to as a "death cross," typically signals that the short-term trend is weaker than the long-term average, indicating that the recovery may not yet be robust enough to establish a new uptrend.

However, the narrowing gap between these two EMAs is a noteworthy development. It suggests that the short-term trend might be strengthening, or at the very least, the bearish momentum is decelerating. While the death cross itself does not guarantee further price declines, it highlights the significant hurdle bulls must overcome to firmly establish a new upward trajectory.
The Average Directional Index (ADX), which measures the strength of a trend rather than its direction, is currently reading 18.1. A reading below 25 generally indicates a lack of strong conviction in the market, suggesting that while prices may move, there isn’t a powerful underlying driver. Given the prolonged bearish period, a weak ADX could imply that the current trend is fading or that strategic accumulation is occurring within this price range.
The Relative Strength Index (RSI), a momentum oscillator that measures the speed and magnitude of price changes, stands at 67.7. While this reading indicates that Bitcoin is approaching overbought territory (typically above 70), it remains within a manageable zone. This suggests that there is still room for price appreciation before significant technical selling pressure intensifies, as traders might begin to lock in profits as the RSI crosses the 70 threshold.
Furthermore, the squeeze momentum indicator, which signals potential price compressions before significant movements, has reportedly shown a release with positive momentum, according to chart analysis. This indicator’s positive signal, coupled with the other developing technical patterns, adds to the bullish narrative that is emerging in the wake of the geopolitical news.
Geopolitical Context: The Strait of Hormuz and Market Stability
The Strait of Hormuz is one of the world’s most vital maritime transit points, serving as the gateway for a significant portion of the global oil supply. Approximately 20% of global petroleum liquids, including crude oil and refined products, pass through this narrow waterway annually. Control over the strait has been a recurring point of geopolitical tension, with potential disruptions having far-reaching implications for global energy security and economic stability.
In recent times, heightened tensions in the Middle East, including incidents involving naval vessels and rhetoric from regional powers, had led to concerns about potential blockades or disruptions to shipping traffic through the strait. These concerns had contributed to increased volatility in oil markets and had served as a backdrop of uncertainty for broader financial markets, including cryptocurrencies.
Iran’s announcement of its commitment to keeping the Strait of Hormuz fully open, particularly in conjunction with an ongoing ceasefire, represents a significant de-escalation of these perceived risks. The immediate impact was a sharp decline in crude oil futures, as the market repriced the risk premium associated with potential supply disruptions. This reduction in energy cost inflation can have a positive ripple effect on consumer spending and business investment, potentially boosting economic growth and supporting riskier assets.
The reference by former President Donald Trump to the waterway as the "Strait of Iran" highlights the political sensitivities and the ongoing discourse surrounding regional security and maritime transit. Regardless of the nomenclature, the assurance of unimpeded passage through this critical chokepoint has been a primary driver of the market’s positive reaction.
Implications for Digital Assets and Corporate Treasuries
The surge in Bitcoin’s price has direct implications for companies that hold significant amounts of the cryptocurrency as part of their treasury reserves. MicroStrategy, a prominent example, has been a vocal advocate for Bitcoin as a store of value and has accumulated substantial holdings. The recent price appreciation would have significantly boosted the value of its Bitcoin reserves, potentially improving its balance sheet and investor sentiment. This correlation underscores the growing integration of digital assets into traditional corporate finance strategies.
The broader digital asset market also benefits from Bitcoin’s positive price action. As the dominant cryptocurrency, Bitcoin’s movements often influence the performance of other digital assets, including altcoins and stablecoins. A sustained rally in Bitcoin could lead to increased investor confidence and capital inflow into the wider cryptocurrency ecosystem.
Myriad Prediction Market Insights
Data from Myriad, a prediction market platform developed by Decrypt’s parent company Dastan, offers a glimpse into market sentiment regarding Bitcoin’s future price movements. Currently, traders on Myriad are assigning a 69% probability to Bitcoin reaching $84,000 before experiencing a decline to $55,000. This indicates a prevailing bullish outlook for an upcoming price surge. The margin in favor of a "pump" is reportedly the widest it has been since the market’s inception in early February.
However, the same platform also reveals a more tempered view on the timeline for new all-time highs. A separate Myriad market suggests only a 6% chance of Bitcoin surpassing its previous all-time high of $126,000 before July. This suggests that while traders anticipate near-term gains, they are more cautious about the speed at which Bitcoin might re-enter and exceed its previous peak.
Future Outlook and Potential Scenarios
The current market scenario presents two primary potential paths forward for Bitcoin. In an optimistic scenario, Bitcoin would maintain its position above the broken descending trendline, which is now expected to act as a support level between $74,000 and $75,000. Furthermore, a sustained increase in the ADX above the 20-25 range would signal a strengthening and more confident trend.
Conversely, if bearish sentiment reasserts itself, a renewed rejection from current price levels, coupled with the RSI declining from its near-overbought status, could lead Bitcoin back to test the aforementioned support area. A decisive break below this support would re-establish the trendline as resistance, effectively invalidating the recent breakout and signaling a return to bearish conditions.
The coming days and weeks will be crucial in determining whether today’s geopolitical catalyst will translate into a sustained recovery for Bitcoin and the broader digital asset market, or if it will prove to be a temporary reprieve from the prevailing bearish pressures. Market participants will be closely monitoring geopolitical developments, macroeconomic data releases, and on-chain metrics for further insights into the market’s direction.
Disclaimer: The views and opinions expressed by the author are for informational purposes only and do not constitute financial, investment, or other advice.


