
No npm install. No React. No 200MB node_modules folder. Just HTML, CSS, and approximately 250 lines of JavaScript that measure your actual internet speed. This project offers a lean, efficient, and transparent approach to assessing network performance, bypassing the complexities and bloat often associated with modern web development frameworks.
Live Demo: https://dsl.nevik.de/speedtest/
The Genesis of a New Speed Test
In a digital landscape saturated with internet speed testing services like Speedtest.net and FAST.com, the question arises: why build another one? The author provides three compelling reasons that underscore the value of this minimalist approach:
- Unrivaled Efficiency: The primary driver is the creation of a speed test that delivers results in under 50 KB. This starkly contrasts with many contemporary web applications that often exceed this size for much simpler functionalities. This efficiency is crucial for users with limited bandwidth or those who prioritize rapid loading times.
- Universal Compatibility: The test is designed to run on any device without requiring external dependencies. This eliminates the need for specific browser plugins, native applications, or complex build processes, making it accessible to a broader audience regardless of their technical expertise or device capabilities.
- Accuracy and Transparency: Unlike some services that may rely on estimations or proprietary algorithms, this project aims for "real measurements." By building the test from the ground up with fundamental web technologies, the author emphasizes transparency in how the speed is calculated, fostering greater trust in the results.
The culmination of these efforts is a speed test that is not only lightweight and universally accessible but also provides genuine, unvarnished measurements of internet performance.
Architectural Blueprint: Three Phases, Three Measurements
A comprehensive internet speed test necessitates the evaluation of three key network performance indicators:
- Latency (Ping): This measures the time it takes for a small data packet to travel from the user’s device to a server and back. Lower latency is crucial for real-time applications like online gaming, video conferencing, and VoIP calls.
- Download Speed: This quantifies the rate at which data can be transferred from the internet to the user’s device. It directly impacts the speed of browsing, streaming video and music, and downloading files.
- Upload Speed: This measures the rate at which data can be transferred from the user’s device to the internet. It is essential for activities such as uploading files, video conferencing, and online gaming where sending data to servers is critical.
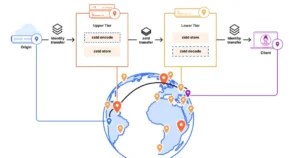
To achieve these measurements, the project leverages the public Cloudflare Speedtest API, accessible at speed.cloudflare.com. Cloudflare’s extensive global edge network, with servers in virtually every country, and its crucial support for CORS (Cross-Origin Resource Sharing) for these endpoints, enables direct measurement from the browser. This eliminates the need for server-side processing or specialized client applications.
The core of the measurement process relies on two primary endpoints:
const CF_DOWN = 'https://speed.cloudflare.com/__down?bytes=';
const CF_UP   = 'https://speed.cloudflare.com/__up';
These endpoints are instrumental in facilitating the download and upload tests, respectively. Notably, they require no API keys, have no rate limits that would impede typical usage, and incur no costs, further contributing to the project’s accessibility and simplicity.
Phase 1: Measuring Ping Without WebSockets
Traditional speed tests often employ complex methods like WebSockets or RTCPeerConnection tricks to measure ping. This project takes a more straightforward approach: it repeatedly loads a minuscule data block (1 KB) five times and records the round-trip time using the performance.now() API.
async function measurePing()
  const times = [];
  for (let i = 0; i < 5; i++)
    const t0 = performance.now();
    try
      await fetch(CF_DOWN + '1000&tid=' + Math.random(),  cache: 'no-store' );
      times.push(performance.now() - t0);
     catch (e)  /* ignore single failure */

  if (times.length === 0) throw new Error('Ping measurement failed');

  times.sort((a, b) => a - b);
  // discard highest, average the rest
  const valid = times.slice(0, Math.max(1, times.length - 1));
  return Math.round(valid.reduce((s, v) => s + v, 0) / valid.length);
Why this approach?
- Simplicity: It avoids the overhead and complexity associated with WebSockets or other real-time communication protocols.
- Browser Native: It relies on standard browser APIs (
fetch,performance.now()) that are widely supported. - Robustness: By performing multiple measurements and discarding the highest value, it aims to mitigate the impact of transient network fluctuations.
It’s important to note that this is not a true ICMP ping, which browsers cannot directly measure. Instead, it’s an HTTP Round-Trip Time (RTT). However, for assessing user experience, which is largely dictated by HTTP traffic, this value is highly relevant and provides a practical measure of responsiveness.
Phase 2: Measuring Download Speed with a Streaming Reader
The download test is where the project truly shines in its efficient handling of large data transfers. Instead of waiting for an entire large file to download before calculating speed, it utilizes the Streams API (response.body.getReader()). This allows the application to process incoming data chunks as they arrive, enabling real-time speed updates.
const DOWN_SIZES = [5000000, 10000000, 10000000]; // ~25 MB total

async function measureDownload(onProgress)
  let totalBytes = 0;
  const tStart = performance.now();

  for (let i = 0; i < DOWN_SIZES.length; i++)
    const size = DOWN_SIZES[i];
    const url = CF_DOWN + size + '&tid=' + Math.random();
    const resp = await fetch(url,  cache: 'no-store' );
    if (!resp.ok) throw new Error('Download HTTP ' + resp.status);

    const reader = resp.body.getReader();
    while (true)
      const  done, value  = await reader.read();
      if (done) break;
      totalBytes += value.length;

      // Live speed calculation
      const elapsed = (performance.now() - tStart) / 1000;
      const currentMbps = (totalBytes * 8) / (elapsed * 1_000_000);
      onProgress(currentMbps, (i + 1) / DOWN_SIZES.length);


  const elapsed = (performance.now() - tStart) / 1000;
  return (totalBytes * 8) / (elapsed * 1_000_000);
Key Design Decisions:
- Multiple Downloads: The use of three sequential downloads (5 MB, 10 MB, 10 MB) instead of one large 25 MB file is a strategic choice. A single large download can be affected by TCP slow-start, where the connection gradually ramps up its speed. By using multiple, progressively larger downloads, the connection is "warmed up" for the subsequent transfers, leading to more realistic sustained speed measurements. This approach provides a better representation of how the connection performs over a short period.
- Bit Conversion: The calculation
totalBytes * 8 / elapsedis fundamental. The factor of 8 is crucial because internet speeds are universally advertised in megabits per second (Mbit/s), not megabytes per second (MByte/s). Omitting this factor would result in a measurement eight times lower than the actual advertised speed, leading to inaccurate comparisons. - Streaming Reader Advantage: Employing
response.body.getReader()is paramount. If the code waited forawait resp.text()to complete, it would be impossible to display live speed updates during the download. The streaming reader provides immediate access to each incoming chunk, allowing for UI refreshes and a dynamic, "breathing" progress bar, as opposed to a static one.
Phase 3: Measuring Upload Speed with XHR
Measuring upload speed presents a unique challenge because the fetch API does not natively support upload progress events. To provide live upload speed feedback, the project resorts to the older but still capable XMLHttpRequest (XHR), specifically utilizing its upload.onprogress event.
const UP_SIZE = 8_000_000; // 8 MB

async function measureUpload(onProgress)
  // Pseudo-random payload against compression
  const payload = new Uint8Array(UP_SIZE);
  for (let i = 0; i < UP_SIZE; i += 4096)
    payload[i] = Math.floor(Math.random() * 256);


  const tStart = performance.now();
  return await new Promise((resolve, reject) =>
    const xhr = new XMLHttpRequest();
    xhr.open('POST', CF_UP + '?tid=' + Math.random(), true);
    xhr.setRequestHeader('Content-Type', 'application/octet-stream');

    xhr.upload.onprogress = (e) =>
      if (e.lengthComputable)
        const elapsed = (performance.now() - tStart) / 1000;
        const mbps = (e.loaded * 8) / (elapsed * 1_000_000);
        onProgress(mbps, e.loaded / e.total);

    ;
    xhr.onload = () =>
      if (xhr.status >= 200 && xhr.status < 300)
        const elapsed = (performance.now() - tStart) / 1000;
        resolve((UP_SIZE * 8) / (elapsed * 1_000_000));
       else reject(new Error('Upload HTTP ' + xhr.status));
    ;
    xhr.onerror = () => reject(new Error('Upload failed'));
    xhr.send(payload);
  );
Key Considerations for Upload:
- Pseudo-Random Data: Uploading a payload of zeros could be subject to compression by intermediate network devices (proxies, ISPs). This compression would skew the speed test, measuring the compression efficiency rather than the actual upload bandwidth. By introducing a random byte every 4 KB, the data becomes practically incompressible, ensuring the test measures true upload speed. While technically not cryptographic randomness, this approach effectively prevents unwanted data compression.
- XHR Fallback for Fetch Limitations: Recognizing that
fetchlacks upload progress events, XHR serves as the primary mechanism for live upload speed feedback. This allows users to see their upload performance in real-time, mirroring the experience of the download test.
Fallback for Upload:
In scenarios where browser configurations or CORS policies might impede XHR uploads, a fallback mechanism using fetch is implemented. This fallback, however, does not provide live progress updates, delivering the final upload speed only upon completion.
async function measureUploadFallback()
  const payload = new Uint8Array(UP_SIZE);
  for (let i = 0; i < UP_SIZE; i += 4096) payload[i] = Math.floor(Math.random() * 256);
  const blob = new Blob([payload],  type: 'application/octet-stream' );

  const tStart = performance.now();
  const resp = await fetch(CF_UP + '?tid=' + Math.random(),
    method: 'POST', body: blob, cache: 'no-store',
    headers:  'Content-Type': 'application/octet-stream'
  );
  if (!resp.ok) throw new Error('Upload HTTP ' + resp.status);
  const elapsed = (performance.now() - tStart) / 1000;
  return (UP_SIZE * 8) / (elapsed * 1_000_000);
The User Interface: An Analog Tachometer in SVG
The technical ingenuity extends to the user interface, where the author opted for a visually engaging analog tachometer instead of a standard progress bar. This is achieved using SVG and the requestAnimationFrame API for smooth animations.
const ARC_LEN = Math.PI * 130; // Semicircle with r=130

function setGauge(mbits, color)
  const pct = Math.min(mbits / MAX_GAUGE, 1);
  gaugeArc.setAttribute('stroke-dashoffset', ARC_LEN * (1 - pct));
  if (color) gaugeArc.style.stroke = color;
  gaugeNum.textContent = mbits >= 100
    ? Math.round(mbits)
    : (mbits >= 10 ? mbits.toFixed(0) : mbits.toFixed(1));


function animateGauge(target, duration, color)
  if (animFrame) cancelAnimationFrame(animFrame);
  const start = parseFloat(gaugeNum.textContent)
The core principle involves a fixed-length semicircle ( ARC_LEN ). By setting stroke-dasharray to this length and manipulating stroke-dashoffset, the visual representation of the speed is dynamically controlled. The easeOutCubic easing function ensures that the needle accelerates quickly and decelerates smoothly, mimicking the behavior of a real tachometer. This provides an intuitive and visually appealing way to interpret the speed test results.
The Verdict: Tariff vs. Measured Speed
Beyond the technical execution of the speed test, the project introduces a critical element: evaluation. Users are prompted to enter their subscribed internet tariff (e.g., 100 Mbit/s), allowing the speed test to provide a comparative analysis.
function updateVerdict(down)
  const pct = (down / currentTariff) * 100;

  if (pct >= 90)
    // Top: You're getting what you pay for
   else if (pct >= 60)
    // Medium: Likely Wi-Fi loss
   else
    // Poor: Tariff or line issue
This comparative feature is vital because many users lack a clear understanding of whether their internet performance is adequate. They might have "a plan" and perceive their connection as "somewhat slow" without concrete metrics. This evaluation transforms an abstract number (e.g., "73 MBit/s") into a tangible assessment: "You are achieving 73% of your 100 MBit/s plan – a wired connection should ideally yield more."
The legal landscape in Germany, for instance, supports this approach. Since 2022, consumers have a legal right to expect that their contracted speed is achieved in most instances. Persistent underperformance can provide grounds for contract termination or switching providers. This speed test empowers users with the data to assert their rights.
Lessons Learned from the Build
The development process yielded several valuable insights:
- The Power of Vanilla JS: The project demonstrates that complex functionality can be achieved with pure JavaScript, CSS, and HTML, without the overhead of build tools or frameworks. This approach significantly reduces the footprint and increases accessibility.
- Cloudflare’s API Utility: The Cloudflare Speedtest API proved to be an invaluable resource, offering a robust and accessible solution for core measurement tasks. Its CORS support was particularly critical for browser-based implementation.
- UI Design Matters: The analog tachometer visualization highlights how thoughtful UI design can enhance user understanding and engagement with technical data.
- Understanding Network Nuances: The challenges encountered in accurately measuring upload speeds and avoiding compression effects underscore the complexities of network performance testing.
Conclusion
The entire speed test – encompassing the UI, tachometer animation, ping, download, and upload measurements, tariff evaluation, and error handling – is remarkably under 50 KB and contained within a single HTML file. It achieves this without build tools, dependencies, or any frameworks.
For those wishing to experience this lean and efficient speed test, it is available at: dsl.nevik.de/speedtest/. The source code can be inspected directly within the browser via "View Source" as it is entirely inline. Users with questions about the implementation or those who identify bugs are encouraged to share their feedback.
Have you ever built your own speed test? What endpoints or APIs did you utilize? We are keen to hear about your approaches in the comments below!
Tags: #javascript, #webdev, #vanillajs, #tutorial, #performance