Reliability Data Confirms Apple TV Outperforms Android in Enterprise Digital Signage Environments

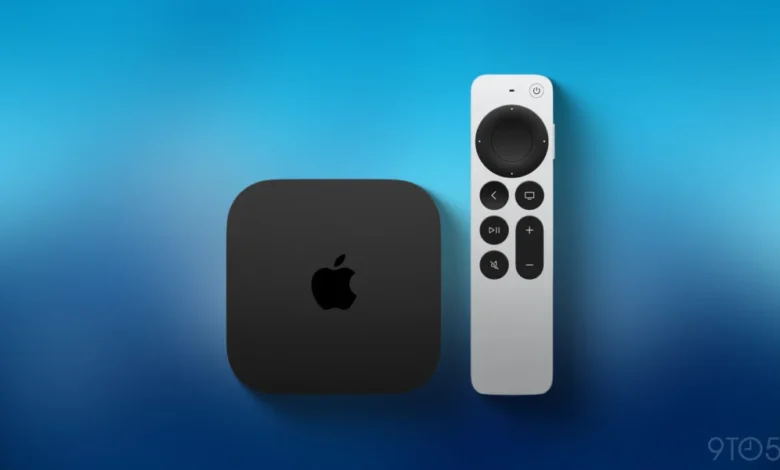
The global digital signage market has undergone a radical transformation over the last decade, evolving from a luxury for high-end retail to a fundamental communication tool for corporate offices, educational institutions, and healthcare facilities. As organizations scale their visual communication networks, the debate between utilizing premium hardware like the Apple TV versus budget-friendly Android-based "sticks" or players has intensified. New telemetry data from the State of Digital Signage 2026 report, published by Kitcast, provides a comprehensive look at the operational realities of these two platforms, suggesting that the initial savings offered by low-cost hardware are frequently erased by long-term maintenance costs and hardware failures.
The Landscape of Modern Digital Signage
Digital signage serves as the visual backbone of modern physical environments. In a corporate setting, it communicates internal KPIs, safety protocols, and company news. In retail, it drives sales through dynamic pricing and promotional content. However, the efficacy of these displays is entirely dependent on uptime. A "black screen" or a visible error message on a commercial floor represents more than just a technical glitch; it is a failure in brand messaging and a drain on IT resources.
Historically, IT departments favored low-cost Android devices for their low entry price, often under $50 per unit. These devices, frequently consumer-grade HDMI sticks, promised a plug-and-play experience. Conversely, the Apple TV, retailing for significantly more, was often viewed as an "over-specced" consumer device. The Kitcast report challenges this perception by analyzing the telemetry of 1,000 Apple TV units and 250 Android devices over a rigorous 12-month period, offering a data-driven look at the Total Cost of Ownership (TCO).

Methodology and Core Findings: The Uptime Gap
The Kitcast study focused on "enterprise reliability at scale," a metric that measures how devices perform when deployed by the hundreds or thousands across geographically dispersed locations. The most striking finding in the report is the disparity in median uptime. Apple TV devices achieved a median 12-month uptime of 99%. In contrast, Android devices hovered at 96%.
While a 3% difference might appear negligible in a casual consumer context, in an enterprise environment, it is substantial. The report notes that 70% of Apple TV devices maintained an uptime of 99% or higher, meaning they functioned for an entire year with virtually no manual intervention or reboots. Only 12% of the Android players monitored were able to reach that same threshold. Even more concerning for IT administrators was the finding that nearly one-third of Android devices fell below 95% uptime, a level of instability that typically requires consistent monitoring and frequent troubleshooting.
The Operational Burden of "Cheap" Hardware
Reliability is not merely a technical statistic; it is a direct contributor to operational expenditure (OPEX). The Kitcast telemetry reveals that the average Android digital signage player goes offline 15.2 times per year. Each of these events triggers an alert, requiring an IT professional to investigate the cause—whether it be a network drop, a software crash, or a hardware freeze.
By comparison, the Apple TV experienced only 5.3 offline events per year. For a company managing 100 screens, this is the difference between handling 530 support tickets versus 1,520. When the cost of labor is factored in—specifically the time spent by IT staff on "truck rolls" or manual reboots—the Apple TV’s higher upfront hardware cost is often recouped within the first 18 months of operation.
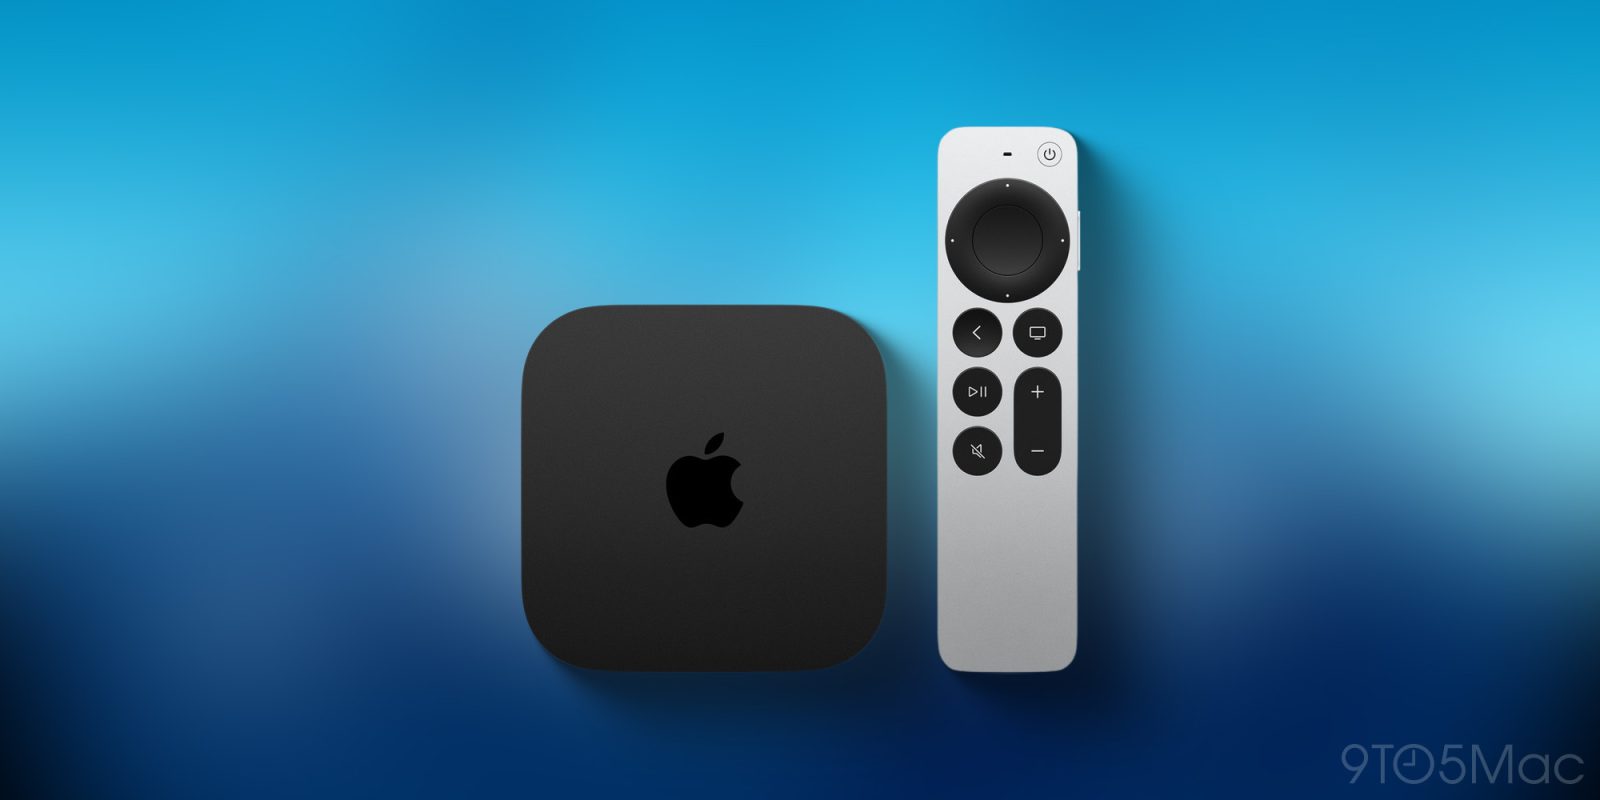
The report also highlights the physical durability of the hardware. Android devices in the study showed an annual replacement rate of approximately 18%. This high turnover is often attributed to thermal management issues in smaller "stick" form factors and the use of lower-grade flash memory that degrades under the constant read/write cycles of digital signage software. Apple TV units, designed with more robust internal cooling and higher-quality components, showed a replacement rate of just 2%.
Technical Analysis: Why the Platforms Diverge
The disparity in performance can be traced back to the fundamental architecture of the devices. Most budget Android players used for signage utilize low-cost System-on-a-Chip (SoC) designs intended for casual media consumption rather than 24/7 commercial operation. These devices often suffer from "memory leaks," where the operating system fails to release RAM after tasks are completed, eventually leading to a system slowdown or a total crash.
Furthermore, Android’s fragmented ecosystem means that firmware updates are inconsistent. A device purchased today might be running an outdated version of the OS with unpatched security vulnerabilities or stability bugs.
Apple TV, powered by Apple’s A-series silicon, possesses a surplus of processing power. Originally designed to handle high-end gaming and 4K HDR video streaming, these chips remain underutilized by standard digital signage applications, allowing them to run cooler and more efficiently. The tvOS architecture is also notoriously stable. Because Apple controls both the hardware and the software, the integration is seamless, reducing the likelihood of driver conflicts or kernel panics that plague generic Android hardware.
The Role of Device Management and Zero-Touch Deployment
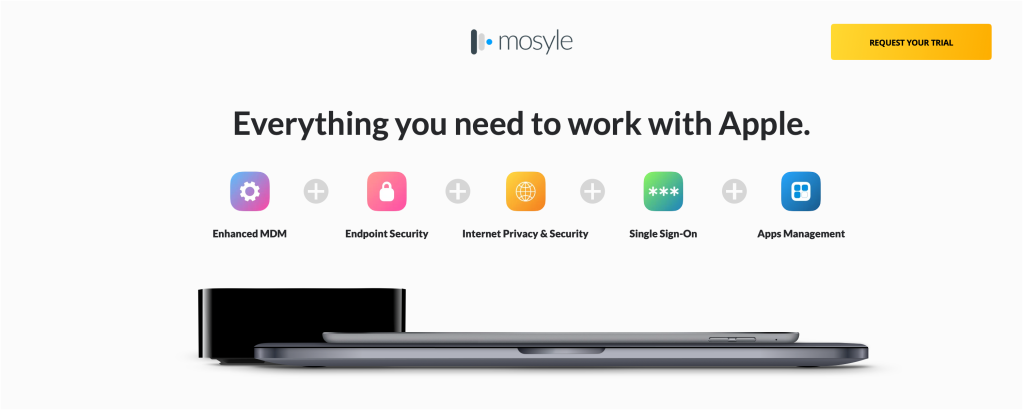
Beyond hardware stability, the "Apple @ Work" ecosystem provides a significant advantage in deployment. Through the use of Mobile Device Management (MDM) solutions, such as Mosyle, IT administrators can utilize "Zero-Touch Deployment." This process allows a device to be shipped directly to a retail location, plugged in by a non-technical employee, and automatically configured over the air.
Once connected to the internet, the Apple TV checks in with Apple’s Business Manager (ABM) servers, downloads its assigned MDM profile, installs the necessary digital signage apps, and enters "Single App Mode." This ensures the device remains locked into the signage application, preventing unauthorized use or accidental exits from the software. While Android has made strides with Android Enterprise and "Zero-touch enrollment," the process remains more fragmented across different manufacturers and hardware versions compared to the unified Apple ecosystem.
A Chronology of Digital Signage Evolution
The shift toward Apple TV as an enterprise standard is part of a broader chronological trend in the industry:
- 2000–2010: The Era of the PC. Digital signage was primarily driven by bulky, expensive Windows PCs hidden behind screens. Maintenance was high, and the systems were prone to "Blue Screen of Death" errors.
- 2011–2017: The Rise of Proprietary Boxes and Android Sticks. Companies moved toward smaller, cheaper form factors. While costs dropped, reliability became a major pain point as consumer-grade hardware struggled with 24/7 runtimes.
- 2018–Present: The Enterprise Appliance Phase. Organizations began prioritizing uptime and security. Apple TV emerged as a "prosumer" favorite, offering a balance of high-end performance and manageable pricing.
- 2024 and Beyond: The AI and Data-Driven Era. Modern signage now requires hardware capable of real-time data rendering and AI-driven content adjustment, favoring powerful chips like the A15 Bionic or newer found in the Apple TV.
Industry Implications and Future Outlook
The findings of the State of Digital Signage 2026 report suggest a shift in procurement strategy for large-scale enterprises. IT directors are increasingly moving away from "lowest bid" hardware in favor of "highest uptime" hardware. This shift is particularly evident in sectors where downtime has a direct financial impact, such as Quick Service Restaurants (QSRs) where digital menu boards are essential for operations.

However, the report also notes a gap in the market. While the Apple TV is the reliability leader, its price point remains a barrier for smaller businesses or deployments with thousands of endpoints. There is a growing call from the IT community for Apple to release a dedicated "enterprise stick" or a lower-cost SKU specifically for the signage and hospitality markets. Such a device would ideally retain the A-series silicon and tvOS stability but strip away consumer-focused features like the Siri Remote to lower the unit cost.
Conclusion: The Strategic Value of Reliability
The Kitcast report serves as a definitive look at the hidden costs of the digital signage hardware market. For IT managers, the data is clear: an 18% annual replacement rate and 15 annual offline events per device create a cycle of "reactive IT" that prevents departments from focusing on higher-value projects.
By choosing a platform with a 99% uptime median and a 2% replacement rate, organizations are not just buying a media player; they are investing in operational stability. As digital signage continues to integrate more deeply into the fabric of corporate and retail life, the premium paid for Apple TV hardware appears less like a luxury and more like a calculated, cost-saving business decision. The move toward Apple TV reflects a maturing industry that finally values the long-term reliability of the appliance over the short-term savings of the hardware.