Google’s BigQuery Measures Reaches General Availability to Bridge the Gap Between Business Intelligence and Knowledge Graphs for Enterprise AI

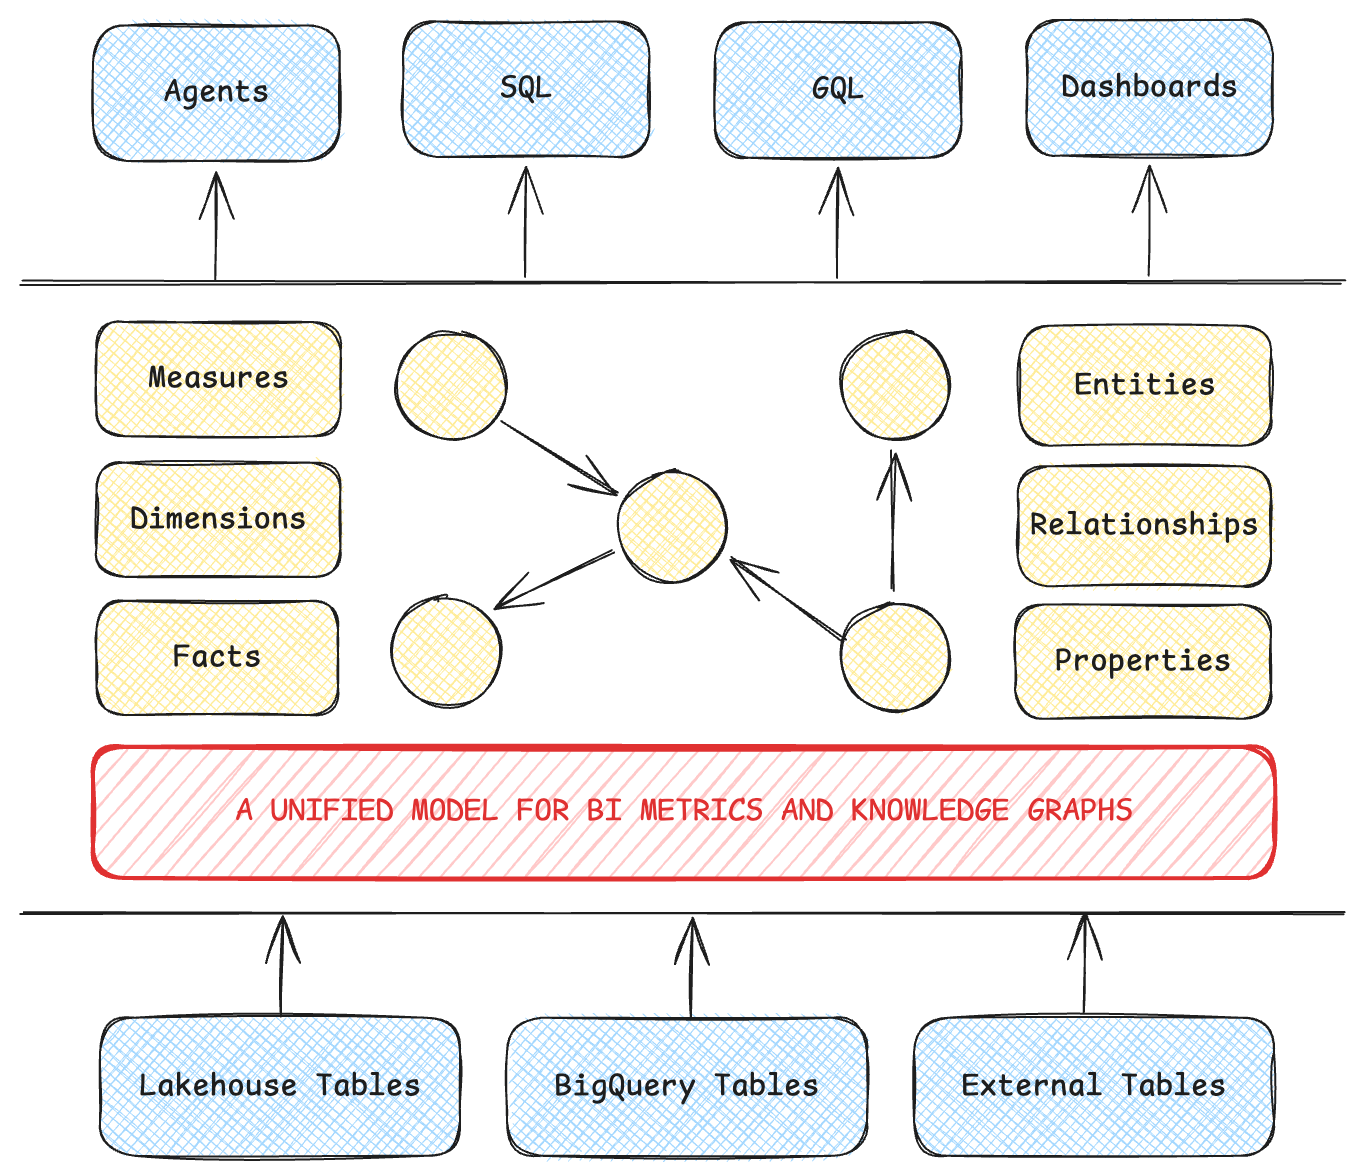
The modern enterprise data stack has long suffered from a structural disconnect, forcing organizations to choose between two isolated paradigms to understand their operations: business intelligence (BI) platforms that calculate reliable metrics, and knowledge graphs that map complex entity relationships. For years, bridging these two worlds required brittle data pipelines, manual reconciliation by data analysts, and sprawling prompt engineering to help artificial intelligence agents make sense of the data. This patchwork approach not only introduced latency and high infrastructure costs but also served as a primary vulnerability for data governance, as different teams inevitably relied on conflicting definitions for standard metrics. To address this fundamental limitation, Google has announced the general availability of measures in BigQuery, introducing a unified model that combines governed BI metrics and knowledge graphs directly within a single cloud-native data architecture.
The Architectural Challenge of What Versus Why
To answer complex business inquiries or to generate reliable insights through agentic AI workflows, systems must simultaneously process two distinct categories of information: what happened and why it happened. The former typically manifests as a governed metric, such as total revenue at risk, while the latter is represented by the interconnected network of relationships and transactional pathways that produced that outcome. Historically, because metric definitions resided within dedicated BI layers while relational data lived inside graph structures, an AI agent or a human analyst could only ever observe half of the picture. When forced to bridge the gap independently, AI models frequently relied on estimation and extrapolation, resulting in confident yet erroneous hallucinations.
Organizations attempting to maintain both environments were forced to run parallel technology stacks, relying on runtime reconciliation and complex join operations. Every department, analyst, and prompt engineer could theoretically define custom joins and metrics differently, leading to metric drift across leadership dashboards and executive reports. By embedding measures natively into BigQuery Graph, Google’s latest release eliminates the need for manual reconciliation. The unified model allows metrics to be defined directly on the graph entities they describe, ensuring that dashboards, SQL queries, and conversational AI agents operate on identical, validated logic.
Real-World Implementation and Grain-Locked Accuracy
The practical implications of this unification are substantial, particularly for complex, highly regulated industries such as retail banking, telecommunications, and global supply chain management. Consider a scenario where a financial institution’s risk analytics team identifies an anomalous surge in transaction volume within a specific geographic district. Determining whether this spike reflects organic customer growth or an acute, concentrated risk exposure requires evaluating two distinct data dimensions: the aggregate volume of capital moved, which addresses the what, and the specific accounts and pathways through which those funds flowed, which addresses the why.
In legacy environments, answering this question would require extracting data across disparate systems, risking discrepancies caused by differing aggregation rules. BigQuery measures resolve this by operating directly over existing native tables or within a borderless lakehouse architecture, requiring zero data movement or secondary system synchronization.
A critical engineering challenge in multi-table analytical environments is avoiding the pitfalls of standard relational joins. For instance, when analyzing a retail bank where a single account may be associated with thousands of individual transactions, a standard SQL join can duplicate account rows and severely distort aggregate calculations. A routine count operation would consequently overcount accounts, providing distorted insights to risk and finance divisions. BigQuery measures incorporate "grain-locked" modeling, which assigns a fixed level of granularity to how facts and dimensions interact. This preserves the native grain of each entity, ensuring that an account is counted exactly once regardless of how underlying tables are joined. Furthermore, analysts can leverage standard SQL alongside GQL—the ISO-standard Graph Query Language—over the exact same underlying model without spinning up separate processing engines.
Advanced Modeling Capabilities for Enterprise Workloads
The general availability release builds significantly upon the initial preview phase by introducing advanced modeling, querying, and visualization features designed to handle complex business logic at scale. Real-world production analytics frequently require composite calculations and derived measures rather than simple summations. The enhanced MEASURE() function now supports both composite expressions and derived metrics. Instead of duplicating complex conditional logic across multiple queries, data engineers can define baseline aggregates once and compose them into higher-order calculations on the same table using the AGG() function.
To safeguard against configuration errors, BigQuery validates formula dependencies at schema compilation time, catching circular references or invalid aggregations before queries are executed. Downstream reporting tools and conversational AI agents can subsequently query complex ratios and net metrics across any dimensionality while maintaining consistent mathematical accuracy. For example, risk teams can define settled transaction volume alongside total volume, subsequently deriving unsettled volume and unsettled percentage directly from those foundational blocks.
Furthermore, the introduction of the start_node argument within the GRAPH_EXPAND function resolves the classic "chasm trap" phenomenon. Enterprise data models routinely span multiple business processes, such as transactions and credit cards linked to a shared bank account. Joining these separate fact tables traditionally results in cross-fact multiplication that artificially inflates metrics. By isolating each fact table into its own expansion tree, BigQuery evaluates each measure at its native grain before joining the results on the shared entity, ensuring that branches maintain their exact mathematical integrity even when dealing with sparse data, such as accounts with active transactions but no issued credit cards.
Integration Across the BI and Agentic Ecosystem
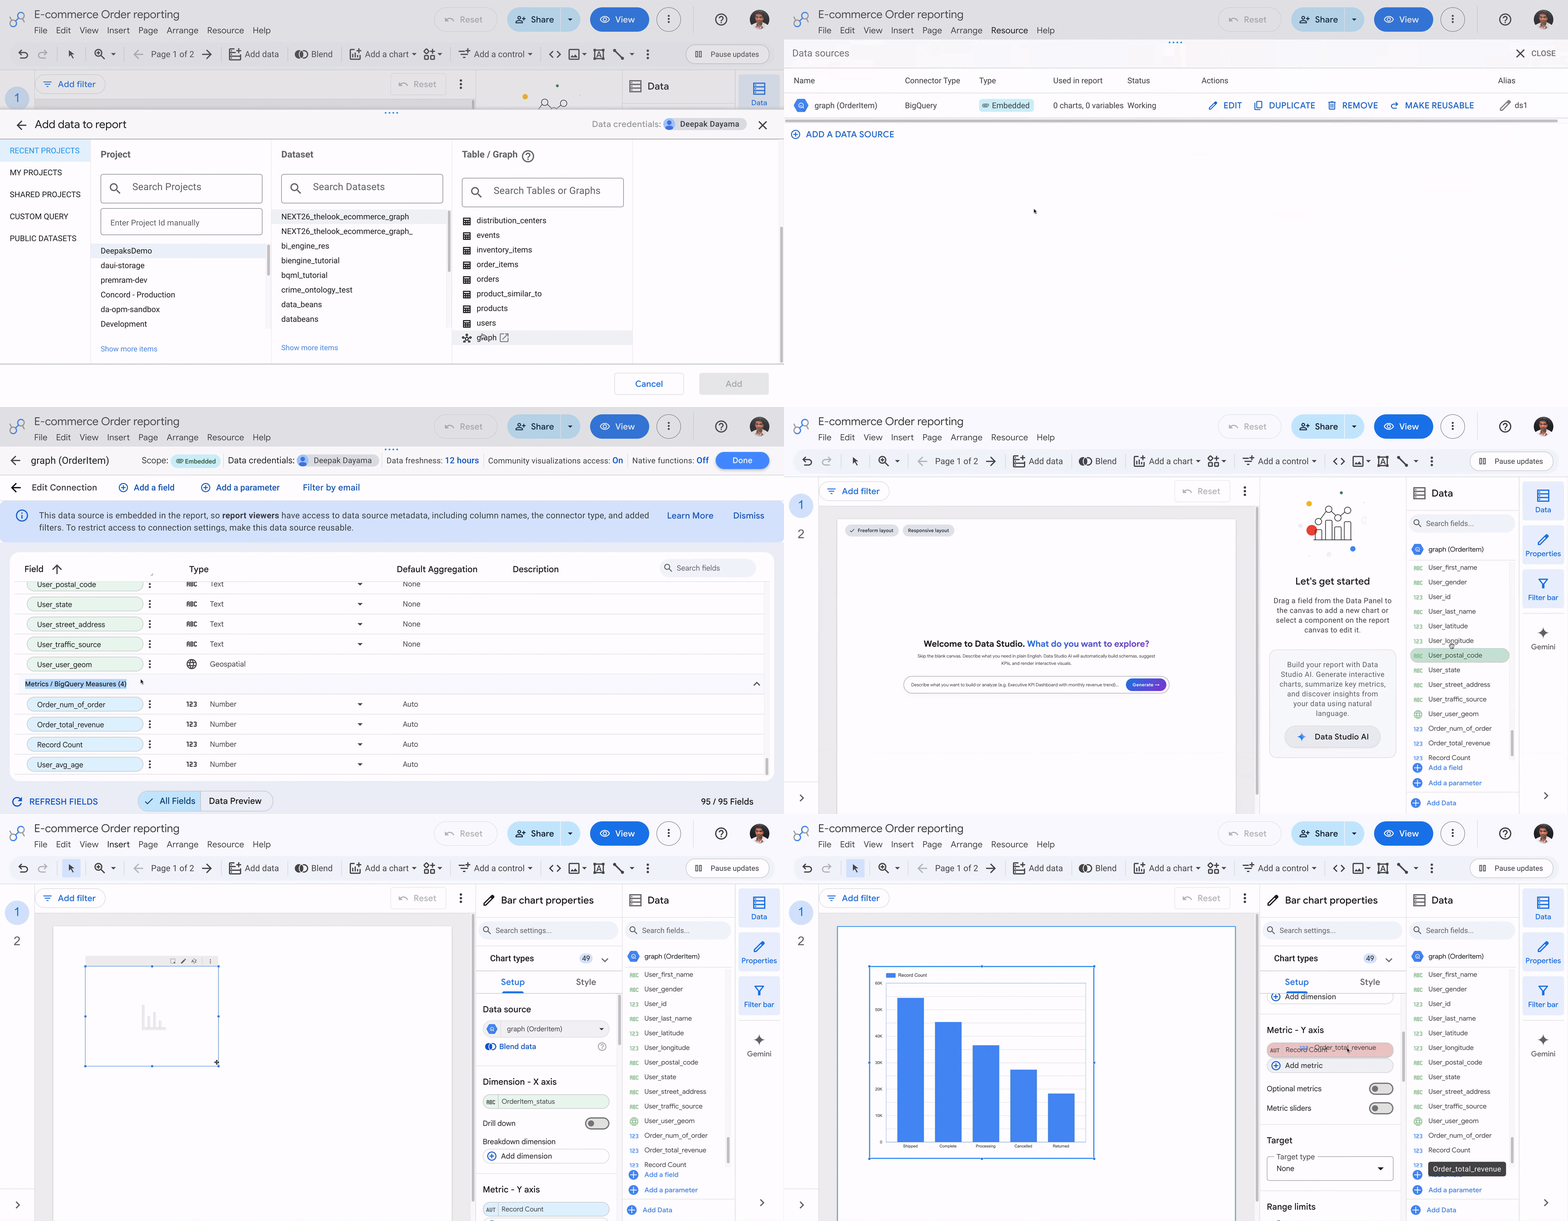
Visualization and discovery represent core pillars of the general availability release. Through an updated BigQuery connector in Data Studio, organizations can now connect directly to BigQuery graphs to construct interactive, real-time visualizations powered by native measures. The connector automatically honors the aggregation logic defined within the graph model, keeping complex calculations uniform across charts and preventing accidental client-side re-aggregations that could corrupt executive dashboards.
As enterprises increasingly adopt autonomous AI agents to automate data discovery and reporting, semantic clarity has become paramount. Large-scale enterprise schemas frequently suffer from naming ambiguities, where multiple metrics share identical colloquial labels. Within a banking schema, for instance, terms like total transaction volume, settled volume, and unsettled volume might all be referred to simply as volume by business users, frequently confusing AI agents attempting to translate natural-language prompts into executable database queries.
To mitigate this ambiguity, the updated platform allows administrators to embed rich semantic metadata directly into individual measure definitions using the OPTIONS clause. This includes plain-language description strings, domain-specific synonyms, and custom key-value extensions. Because this business context travels directly alongside the SQL formula within the schema, semantic definitions remain uniform wherever the metric is queried, whether by a human data analyst or an autonomous agent interacting through enterprise chat interfaces.
Industry Response and Strategic Implications
Early adopters of the technology have reported significant efficiency gains in data governance and maintenance. Amanda Reelick, Head of Data Enablement at Woolworths NZ, noted the operational impact of the new architecture, stating that the ability to deliver self-documenting data products natively within BigQuery ensures that downstream reporting tools, conversational agents, and data team queries operate on identical logic. According to Reelick, this guarantees metric alignment across leadership tiers while substantially reducing the maintenance overhead traditionally required by data engineering teams.
The broader implications of Google’s unified modeling approach point toward a maturation of the enterprise AI landscape. By bridging the structural divide between relational metrics and graph-based relationship mapping, cloud providers are attempting to eliminate the primary technical driver of AI hallucinations in business settings. As organizations transition from experimental AI deployments to mission-critical, agentic workflows, the demand for governed, context-aware semantic layers will only accelerate. Google’s integration of BigQuery measures with Knowledge Catalog and the broader Google Cloud AI ecosystem signals a definitive shift toward unified data architectures designed to serve human decision-makers and autonomous algorithms with equal precision.
Related posts: