Unlocking Kubernetes Network Observability: How GKE Metadata Transforms VPC Flow Logs for Enterprise Troubleshooting

Operating modern Kubernetes environments at scale requires deep, real-time visibility into complex network traffic patterns. When microservices degrade or lose connectivity, site reliability engineers and network administrators must quickly identify communication bottlenecks to isolate faults. In traditional enterprise cloud networks, virtual private cloud (VPC) flow logs fulfill this role by recording metadata-rich connections between static IP addresses, ports, and protocols. However, native Kubernetes environments present a unique architectural challenge due to the ephemeral nature of pods. As containerized workloads scale dynamically, crash, or migrate across physical compute nodes, their IP addresses shift constantly.
Consequently, a standard cloud log entry indicating that IP address 10.4.2.18 is communicating with 10.4.8.44 provides minimal context regarding the underlying workload, the originating namespace, or the intended application endpoint. By the time an engineer queries the cluster infrastructure during an active incident, the target pod may have already terminated, erasing valuable forensic evidence.
To bridge this operational observability gap within Google Cloud environments, infrastructure architects have increasingly turned to integrated network telemetry solutions. Google Cloud’s virtual network fabric inherently observes every connection established by a pod. By capturing these interactions, the platform annotates each sampled flow with comprehensive Google Kubernetes Engine (GKE) metadata directly associated with the active IP address at the moment of recording. This mechanism captures the precise pod identity, workload classification, namespace, and service context without requiring teams to deploy resource-intensive sidecar proxies or supplementary network agents. This approach complements existing in-cluster Container Network Interface (CNI) telemetry tools, delivering workload-level attribution for Layer 3 and Layer 4 traffic natively.
The Evolution of Kubernetes Network Telemetry and Background Context
Historically, deep network visibility in containerized environments necessitated the deployment of complex data plane monitoring tools, custom eBPF (Extended Berkeley Packet Filter) programs, or heavy service mesh sidecars. While these in-cluster solutions offer granular visibility, they introduce operational overhead, consume cluster resources, and add complexity to cluster upgrades and maintenance lifecycle management.
Recognizing these industry-wide challenges, cloud providers have prioritized native telemetry integration. The convergence of software-defined networking (SDN) and container orchestration layers allows cloud platforms to intercept and enrich network flows at the hypervisor or virtual switch level before the packets even reach the guest operating system. Google Cloud’s implementation of enriched VPC Flow Logs represents a paradigm shift, shifting the burden of network metadata collection from the application runtime down to the underlying cloud infrastructure layer.
The integration architecture functions by sampling traffic directly inside Google Cloud’s virtual network fabric. When network flow logs are explicitly enabled on a subnet hosting a GKE cluster, every record of pod traffic traversing the VPC is automatically paired with the Kubernetes context that held ownership of the IP address at the exact timestamp of the network sample. This foundational design choice guarantees that historical context remains intact and queryable long after ephemeral workloads have scaled down or crashed.
Furthermore, enterprises leveraging App Hub to manage business-critical applications can register their GKE workloads to automatically propagate application-level labels—specifically apphubSource and apphubDestination. These labels explicitly define the business application context, operational environment, and criticality of each communicating endpoint. This capability proves exceptionally valuable when containerized microservices interact with managed external endpoints outside the primary cluster boundary, such as serverless Cloud Run services or managed databases.
Prerequisites and Architectural Configuration Steps
Deploying enriched VPC Flow Logs across an enterprise cloud footprint requires a structured, multi-step configuration process designed to prepare logging infrastructure, network policies, and cluster-level components.
The initial administrative prerequisite involves upgrading the default Cloud Logging bucket to support Observability Analytics (formerly known as Log Analytics). Because Network Intelligence Center’s Flow Analyzer queries logs exclusively from upgraded log buckets—typically the _Default global bucket—administrators must execute an explicit update command using the Google Cloud CLI (gcloud). It is critical for platform operators to note that this storage bucket upgrade is a permanent architectural change. Administrators can execute this transition via the terminal:
gcloud logging buckets update _Default --location=global --enable-analytics
Following the storage upgrade, administrators must enable VPC Flow Logs at the organization level to ensure comprehensive coverage across all current and future subnets and VPC networks. This organizational configuration requires the Network Management Admin role. By retaining the include-all-metadata parameter, organizations guarantee that every generated flow record preserves rich namespace and pod attribution details. To balance deep observability requirements against long-term log ingestion and storage costs, administrators can configure secondary parameters such as custom flow sampling rates (--flow-sampling), specific aggregation intervals (--aggregation-interval), or targeted filter expressions (--filter-expr) to capture only high-priority traffic patterns. The configuration command follows this structure:
gcloud network-management vpc-flow-logs-configs create CONFIG_NAME --location=global --organization=ORGANIZATION_ID --metadata=include-all-metadata
The final configuration requirement involves activating intranode visibility within the GKE cluster architecture. While Google Cloud’s managed GKE Autopilot clusters enable intranode visibility by default, administrators operating standard, user-managed GKE clusters must explicitly activate the feature. Operators should exercise caution during this phase, as enabling intranode visibility forces a rolling restart of the cluster control plane and node components, introducing minor per-node resource overhead. Consequently, network teams are strongly advised to test this configuration within a staging or non-production environment prior to enterprise-wide rollout:
gcloud container clusters update CLUSTER_NAME --location=LOCATION --enable-intra-node-visibility
Visualizing Network Traffic and Workload Dependencies in Flow Analyzer
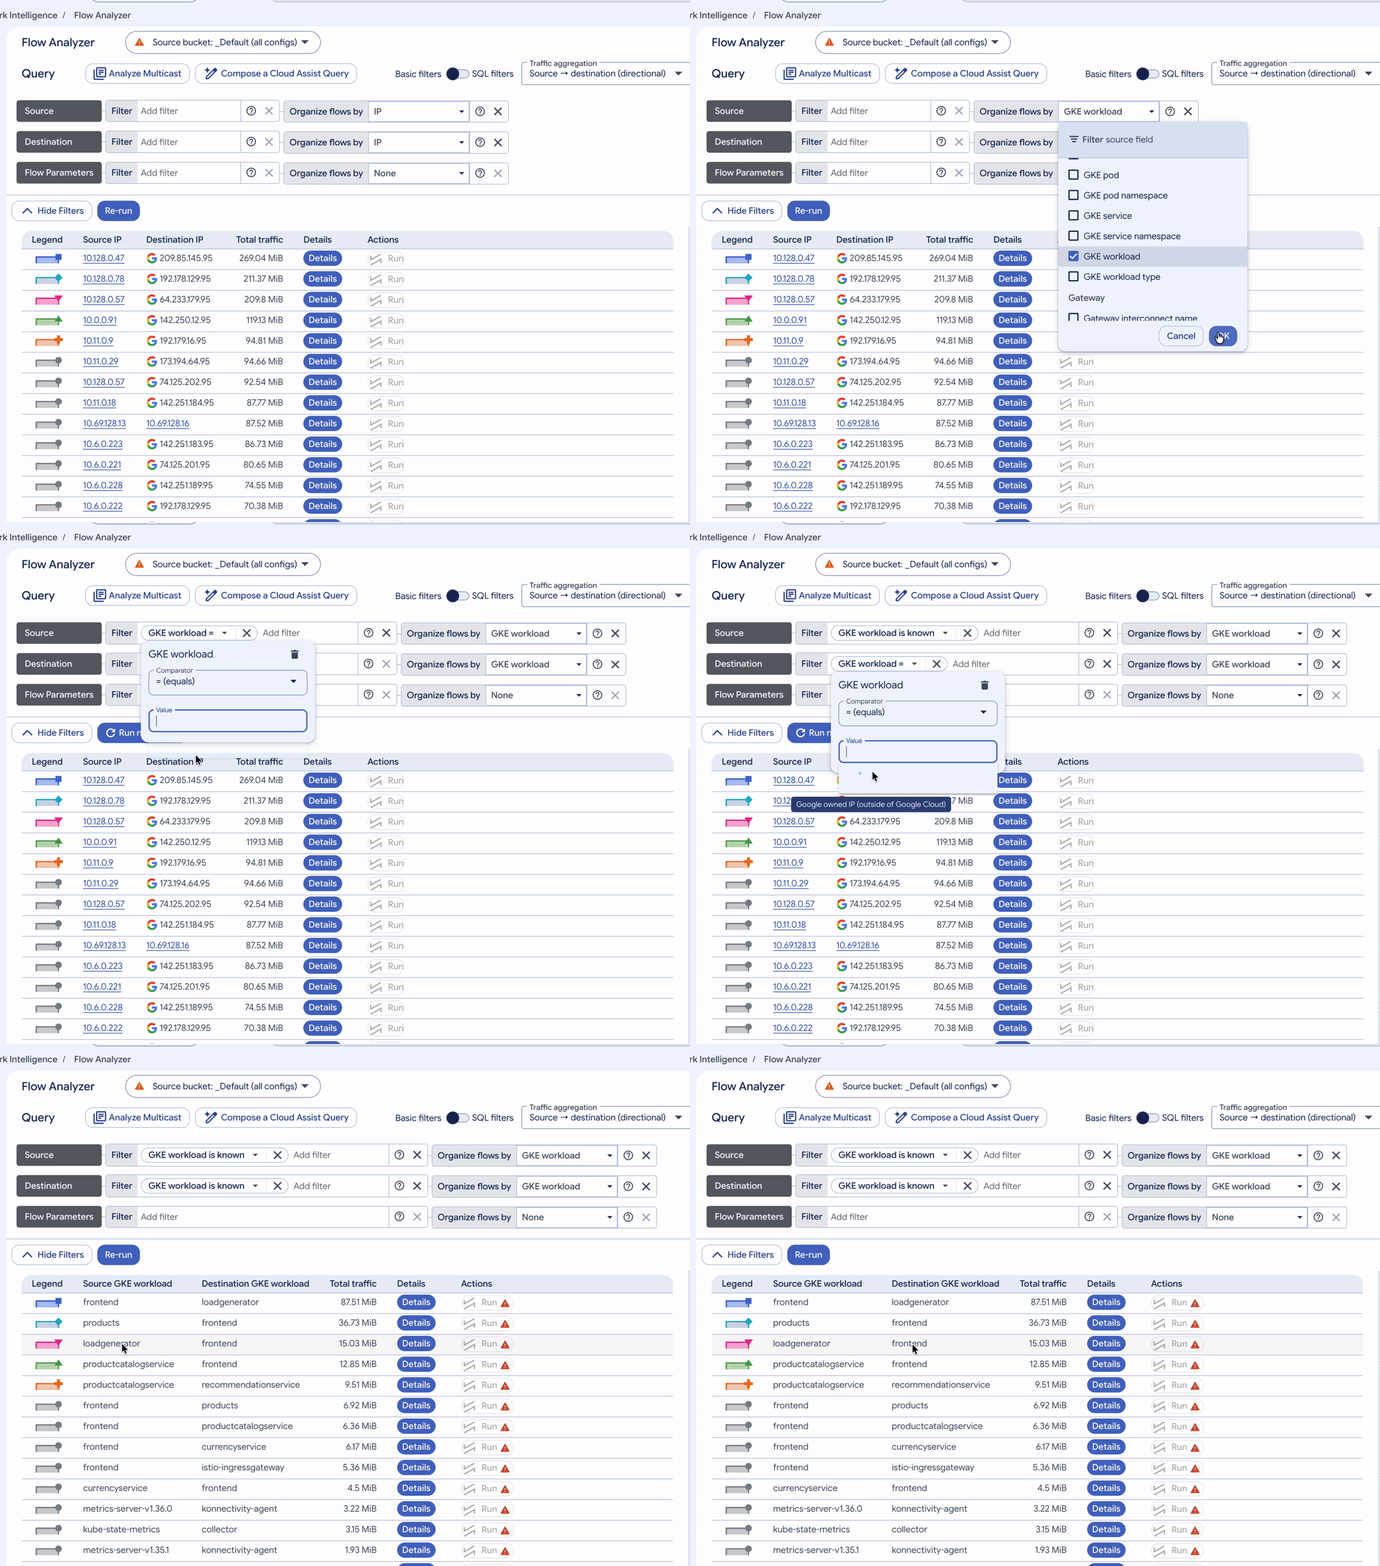
Once network logs are actively streaming into Cloud Logging and enriched with Kubernetes metadata, engineers can query the data using standard SQL syntax within Log Analytics or explore the information visually through Flow Analyzer, an integrated capability of the Network Intelligence Center. Flow Analyzer transforms raw JSON log streams into interactive graphical dashboards and structured data tables, allowing operators to filter, group, and analyze traffic by cluster, namespace, workload, pod, or service within seconds.
To evaluate the operational effectiveness of enriched flow logs, architectural walk-throughs frequently reference Online Boutique, an open-source microservices demonstration application deployed on a regional GKE Autopilot cluster. In this standard test topology, a dedicated loadgenerator deployment simulates continuous web shopper traffic directed at a public-facing frontend service. The frontend subsequently dispatches synchronous remote procedure calls (RPCs) to a constellation of backend microservices, including productcatalogservice, cartservice, currencyservice, recommendationservice, shippingservice, adservice, and checkoutservice.
Case Study 1: Translating Ephemeral IP Addresses into Workload-Level Dependencies
During incident investigations or structural architecture reviews, engineers consistently confront the same initial diagnostic challenge: determining which service endpoints are actively communicating and quantifying the volume of data exchanged. Rather than confronting fragmented lists of ephemeral IP address pairs, Flow Analyzer leverages GKE metadata to map interactions directly to Kubernetes workload names.
To build this application dependency map within Flow Analyzer, operators configure the grouping parameters to display traffic sorted by Source GKE Workload and Destination GKE Workload. When sorted by data volume, the resulting data table serves as an immediate, auto-generated service dependency graph. In the Online Boutique topology, the frontend workload prominently handles incoming requests originating from the loadgenerator, while the productcatalogservice answers concurrent requests from both the recommendationservice and the frontend.
Because every row in the telemetry table exposes official Kubernetes workload names rather than obfuscated IP addresses, unauthorized cross-namespace communication or unexpected workload-to-workload dependencies become immediately conspicuous to security and operations teams.
Case Study 2: Granular Service Inspection and Latency Profiling
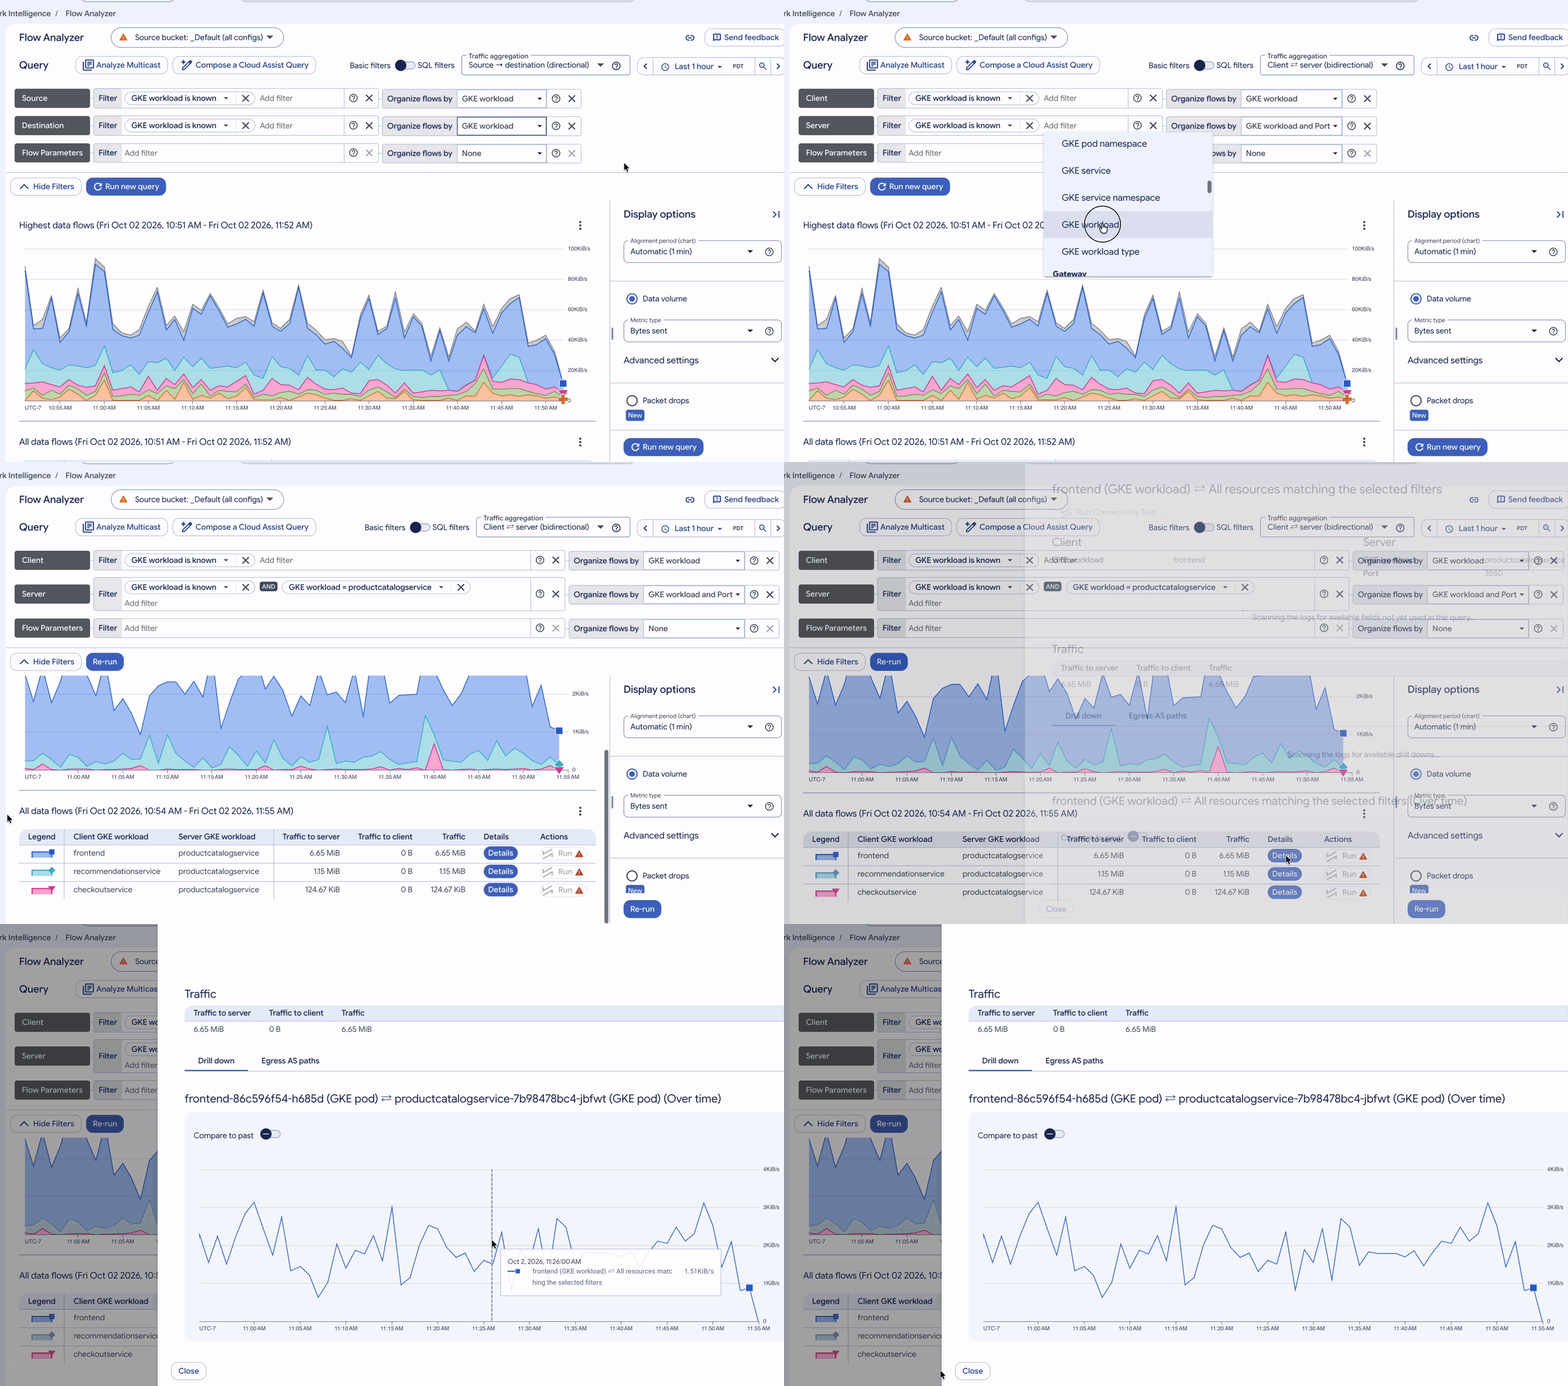
When a specific microservice experiences performance degradation or is scheduled for major architectural refactoring, engineering teams must identify all upstream callers and quantify their respective traffic shares.
By filtering Flow Analyzer to target a specific Server GKE Workload—such as the productcatalogservice—and applying a bidirectional client-to-server aggregation view, operators instantly reveal a comprehensive inventory of every service calling the catalog. The interface displays each caller’s exact percentage share of total traffic alongside an interactive timeline tracking the health and throughput of each service pair. If an individual caller’s traffic volume spikes while others remain flat, engineers can immediately isolate the root cause of the anomaly. Furthermore, when troubleshooting latency bottlenecks rather than raw throughput, operators can instantly toggle the display mode from volume to latency metrics, ranking callers by round-trip response time.
Case Study 3: Identifying and Mitigating Cross-Zone Data Transfer Costs
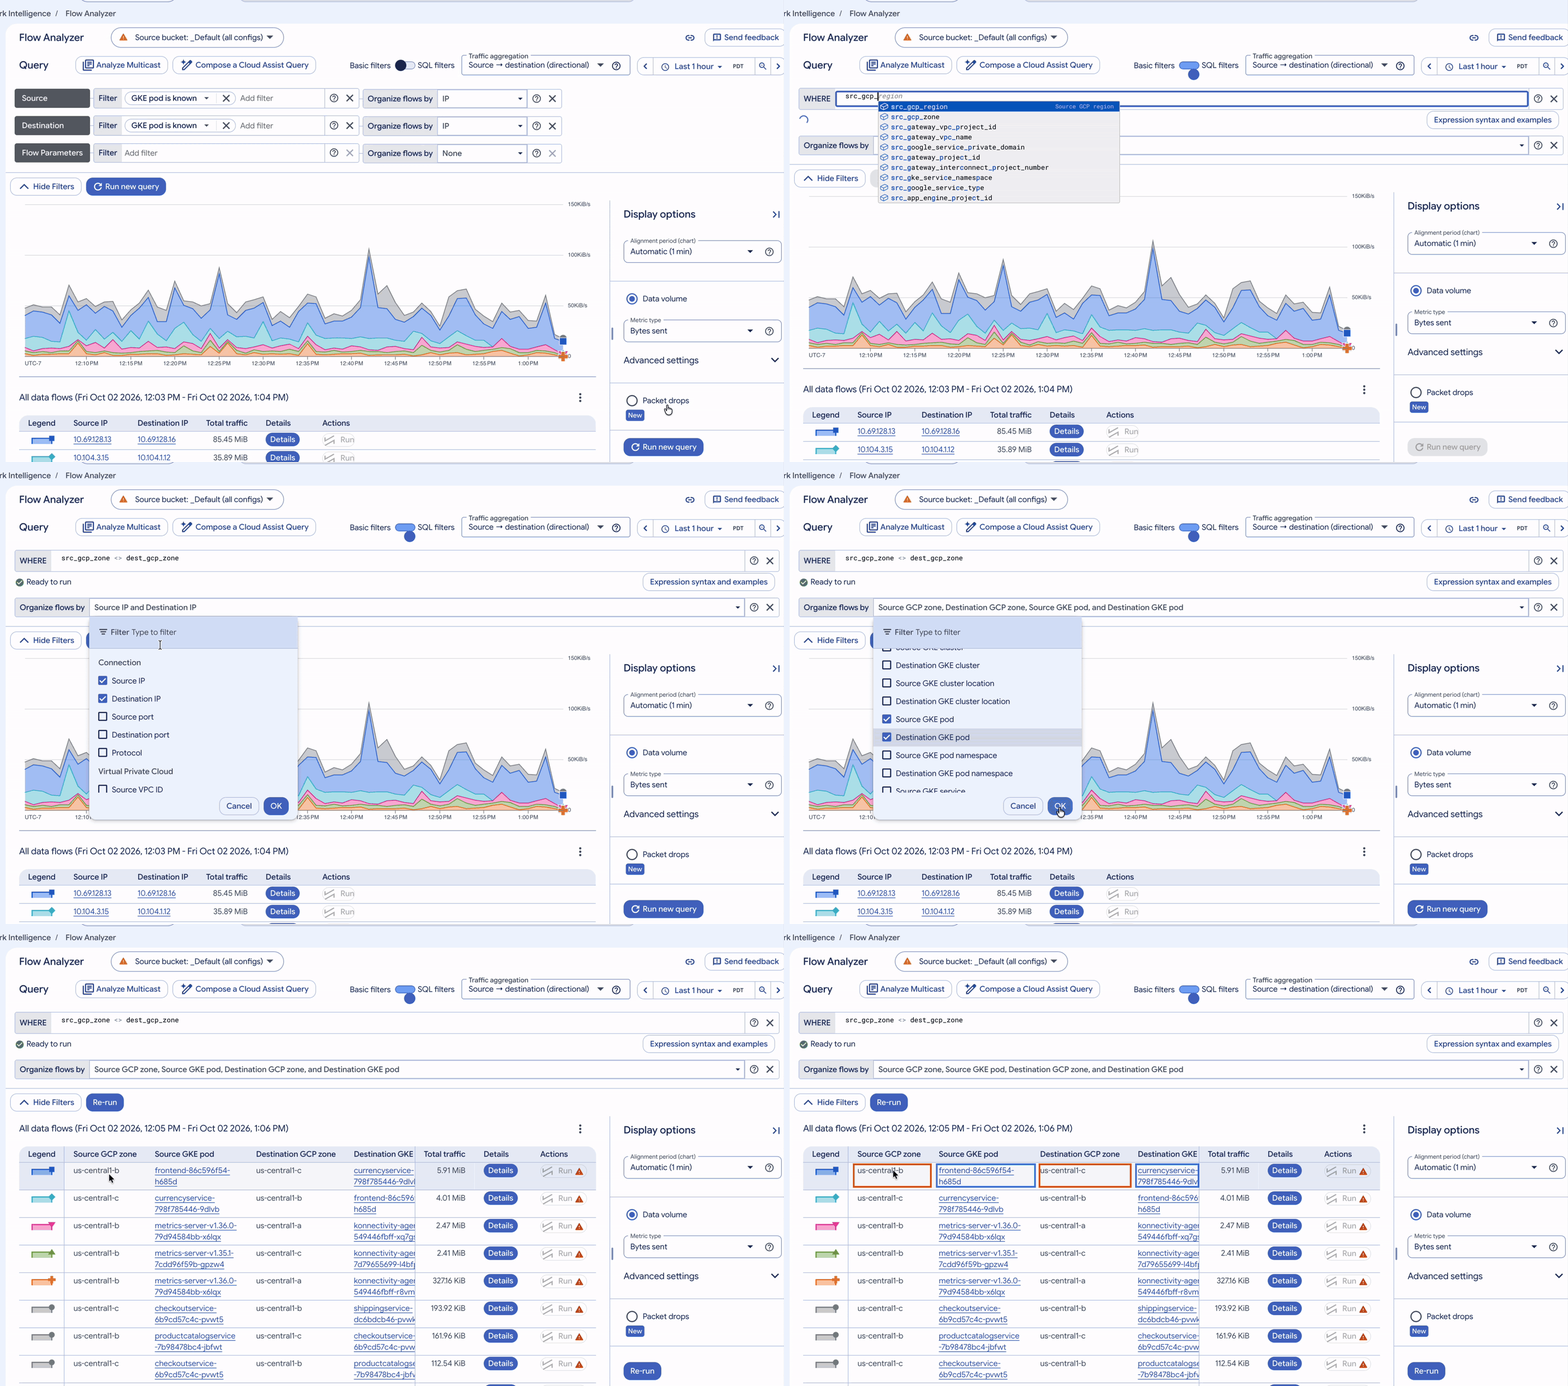
In regional GKE deployments spanning multiple availability zones, chatty microservice architectures that inadvertently place dependent pods in separate zones incur significant, recurring inter-zone network data transfer charges. Because VPC Flow Logs record the exact Google Cloud availability zone at both the source and destination endpoints of every network flow, identifying the specific pod pairs driving cross-zone expenses is straightforward.
Using custom SQL filter expressions within Flow Analyzer—such as isolating records where src_gcp_zone <> dest_gcp_zone combined with multi-attribute grouping—engineers can rapidly isolate cross-zone traffic ranked by volume. In standard multi-zone clusters, prominent cross-zone flows frequently manifest between a frontend pod residing in one availability zone and backend dependencies such as the currencyservice, checkoutservice, or productcatalogservice deployed in separate zones. For deeper forensic analysis, engineers can click "Explore in Log Analytics" to transition seamlessly into the underlying SQL query editor, enabling advanced customizations such as custom time-bucket aggregations or schema joins.
To resolve cross-zone data transfer inefficiencies, GKE provides native scheduling controls. By configuring the Kubernetes Service definition with trafficDistribution: PreferSameZone (or PreferClose in legacy versions), workloads prioritize routing network traffic to healthy endpoints residing within the caller’s local availability zone, provided that cluster autoscaling maintains sufficient replica distribution across zones.
Strategic Implications and Best Practices for Enterprise Adoption
The integration of GKE metadata into VPC Flow Logs represents a mature evolution in cloud-native observability, bridging the historical divide between infrastructure networking teams and application-level Kubernetes operators. By automating the attribution of ephemeral pod identifiers, namespaces, and App Hub application labels directly into network telemetry, organizations significantly reduce Mean Time to Resolution (MTTR) during critical production incidents.
However, enterprise architects must approach large-scale telemetry deployments with strategic foresight. Administrators must carefully balance the granularity of network log collection against associated Cloud Logging ingestion and storage expenditures. Utilizing secondary sampling rates, aggregation intervals, and targeted filter expressions ensures that teams capture critical security and diagnostic data without generating unmanageable log volumes. Furthermore, organizations should mandate non-production testing prior to activating cluster-level features such as intranode visibility to prevent unintended control plane disruption.
As microservice architectures continue to scale in complexity, native cloud-network telemetry solutions will remain foundational to maintaining resilient, secure, and cost-effective Kubernetes environments. Organizations that successfully unify network flow visibility with Kubernetes metadata will be best positioned to maintain operational excellence across modern hybrid and multi-cloud infrastructures.